In-The-Can Measurement of Soot Distribution in a DPF
Soot measurements are technically the most difficult to make, because the carbon has a low atomic number, and produces very little contrast in X-Ray images. Never the less, with good experimental technique and 3DX-Ray image processing software, the data can be extracted from the background noise. The work described below was performed at Oak Ridge National Laboratory.
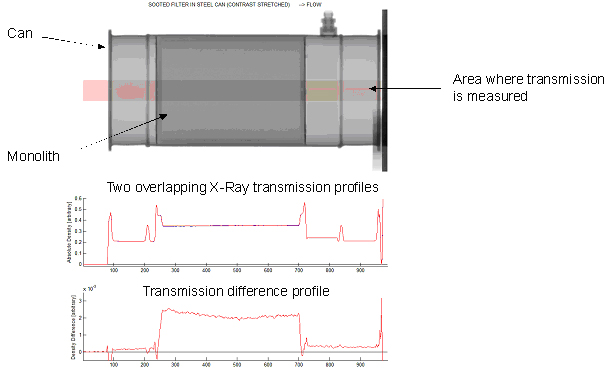
The top X-ray image shows a DPF inside a metal can. Images were taken before and after the filter was filled with soot, during a diesel engine test. The image intensity was measured in the area showed by the transparent red band.
Soot was introduced artificially into the DPF. The graph shows difference between scans measured before and after sooting. The raised centre section shows the change in x-ray transmission due to the presence of soot.
The blue line is the zero (no difference) reference. A higher value means more absorption and therefore more soot. The data shows that there is more soot at the left (inlet) side of the filter and decreasing amounts to the right (exit) end of the filter.
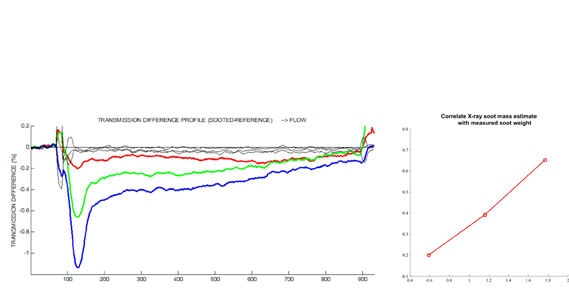
Correlation of X-ray soot mass estimate with measured soot weight
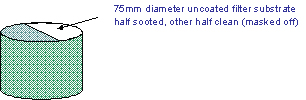
A 75 mm-uncoated substrate was masked off. Half of the DPF was filled with soot using a vacuum process. The sample was imaged before and after sooting, with different weights of soot. The weights are shown in the chart below:
|
Soot Loading |
| |
Added Weight |
Total |

|
+0.59g |
0.59g |

|
+0.57g |
1.16g |

|
+0.61g |
1.77g |

|
Clean section profiles |
| |
|
|
|
|
|
|